
The Real Cost of a Climb — and Why Your Ride Average Hides It
We isolated 1,900+ hours of pure climbing, second by second. On the steep stuff you're pushing more watts and going half your flat speed — but your ride average quietly buries it.

Two riders finish a 30-mile ride at exactly 17.0 mph average. On paper, a tie. But one rode a pancake-flat loop and the other went up and over a mountain. Are they really the same? Every cyclist knows in their legs that they're not. The hard part has always been putting a number on what the hills actually cost you — because a ride average blends the grind up with the free-speed rush back down, and the two cancel out into one tidy, misleading figure.
So we took it apart. CycleLytic categorizes every ride second by second, which let us do something a ride average can't: throw away every flat and descending second and look only at the climbing.
What climbing really costs
We isolated the uphill seconds from thousands of rides — more than 1,900 hours of pure climbing — and lined speed up against gradient, using only rides recorded with a real power meter.
One thing to be clear about up front: this is a cross-section of the CycleLytic community — everyday committed cyclists logging real outdoor rides, not professionals, not lab subjects. These are the watts and speeds of riders like you, which is exactly what makes the numbers relatable rather than aspirational.
The result is brutal and clean. On a gentle 1–2% rise you're rolling along at about 14.9 mph. By 5% you're down to 10.8. On the steep 10%+ ramps, 8.3 mph — barely more than walking pace on the flat, and less than half the speed those same riders hold on level ground.
But look at the second line on the chart above, because it's the real story: as the road tips up, riders don't ease off — they push harder, from around 150 watts on the shallow stuff to over 250 on the steep. You spend more and go slower. That's the part no average will ever tell you — even though it's exactly what your legs already know.
Why the raw curve understates it
Here's a subtlety worth pausing on. The visible curve drops roughly half an mph for every extra 1% of gradient. But that number is too kind — because riders are quietly spending more power as it steepens, propping the speed up. Hold power constant, compare like effort with like, and the true cost of gradient is steeper still: closer to 0.9 mph for every 1% of grade.
In other words, the harder you look, the worse climbing gets. The only reason it doesn't feel twice as bad is that you're paying for it in watts instead of time.
The average that lies
Now bring the descents back and look at the whole ride, the way Strava does. Across roughly 8,900 rides, holding power constant, a hillier ride costs about 0.7 mph off your overall average for every extra 10 ft of climbing per mile — flattening a ~20 mph flat-day average down toward ~12 on a genuinely mountainous one.
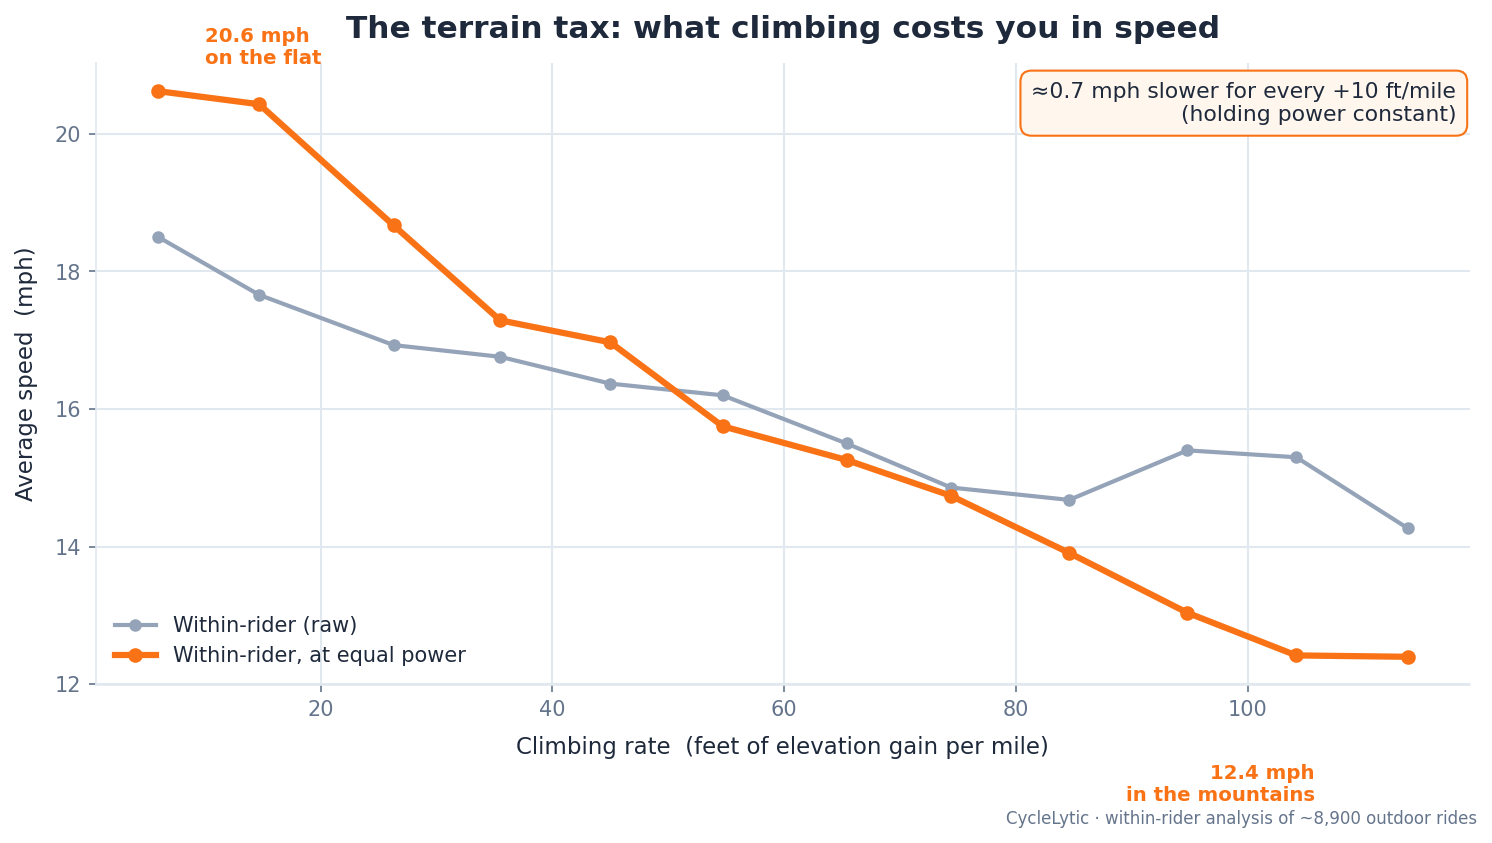
That's real, but it's the gentle version of the truth. The ride average is softened by every descent where gravity hands your speed back. Strip those away — as the first chart does — and you see what the climbing itself was doing: dragging you down to 8–15 mph while you worked harder than anywhere else on the ride. The average didn't lie by much on any single ride, but it hid where the effort and the slowness actually lived.
The CycleLytic take
This is the entire reason CycleLytic refuses to reduce your riding to one blended number. "Am I getting faster?" is unanswerable from a ride average — a hillier month makes you look slower even as you get stronger, and an easy flat block flatters you into thinking you've improved. Categorize every ride by terrain, compare climbing to climbing and flat to flat at equal effort, and the real trend finally surfaces.
Curious how your own riding breaks down? CycleLytic sorts every ride by terrain and shows your speed, power and heart rate for each type — flat, rolling, hilly, mountain — so you can finally compare climbing to climbing and flat to flat. See it on a fully loaded demo account, no signup, at cyclelytic.com/demo.
Methodology: CycleLytic analyzes each ride second by second. Speed, power and gradient are read from the same time-aligned per-second streams, so each second's speed is matched to that same second's gradient. Gradient comes from the smoothed grade stream — very sharp grade transitions can blur slightly across adjacent bands, but this averages out across ~1,900 hours of climbing and doesn't bias the trend. The climbing curve bins only uphill seconds (grade ≥ 1%) by instantaneous gradient; the ride-average "terrain tax" bins whole rides by feet of climbing per mile — the same measure at two scales (52.8 ft/mi ≈ 1% grade). Power-controlled figures hold watts constant to compare like effort with like. This is a cross-section of the CycleLytic community — everyday riders logging real outdoor rides with power meters, not professionals or lab subjects.
Turn your rides into real gains
You just read the tech — now see it in your own data. CycleLytic reads your climbs, power, and terrain: the context Strava and Garmin leave out.
Start 3 months free →No card required · cancel anytime