Inside CycleLytic: Terrain-Categorized Analytics for Honest Performance Tracking
Strava, Garmin, TrainingPeaks all hand you raw averages with no context attached. CycleLytic builds terrain back in — so your weekly trend actually means something.
You finish a 30-mile ride with 2,400 feet of climbing at 14.7 mph. Last week you did 30 flat miles at 18.2 mph. Both numbers land on the same trend line. Neither one tells you a thing about whether your fitness changed.
That's not because cycling analytics is hard — it's because every mainstream tool ignores the context. Strava, Garmin, TrainingPeaks, every consumer dashboard reports the raw average and walks away. The work of mentally adjusting for what the terrain demanded is left to the rider. Most don't bother. Even the ones who try can't compare rides cleanly when every one has different conditions baked in. CycleLytic was built to put the context back.
What the average leaves out
A single avg-speed number isn't wrong — it's just stripped of context. A mile of flat tarmac and a mile of 8% climb impose entirely different physiological loads. Reporting them as one ratio, with no breakdown of how much of each was in the ride, leaves the cyclist to do the interpretation work. The information needed to do it isn't on the screen.
Stretch this across a season and the silence compounds. Your weekly average bounces around with whatever route mix you happened to ride. The dashboard shows the number going up or down but never says why. There's no way to tell whether you're getting faster or whether you just had fewer mountain days.
Categorized, not collapsed
CycleLytic buckets every mile of every ride by its elevation gain per mile — terrain buckets. 0–20 ft/mi is flat, 20–40 is rolling, 40–60 is hilly, 60–80 is steep, 80+ is climbing. Each ride contributes minutes-by-bucket and speed-by-bucket to your profile.
Three months in, you see things you've never seen before. Flat-terrain speed is up 1.4 mph year-over-year. Steep-terrain VAM plateaued in April. Rolling-terrain heart rate at the same speed is lower in May than March — meaning your aerobic engine is improving even though the rolled-up average looks flat because you did more climbing this month.
Nothing collapses. Every chart shows what you actually did, separated by what the terrain demanded.
A tour of the surfaces
At-a-Glance dashboard. The first thing you see. Week, Month, Year, and Lifetime cards with distance, elevation, ride count, and cumulative TSS. Click any card and a sortable history modal opens — last 4 weeks, last 12 months, every year back to the start of your history.
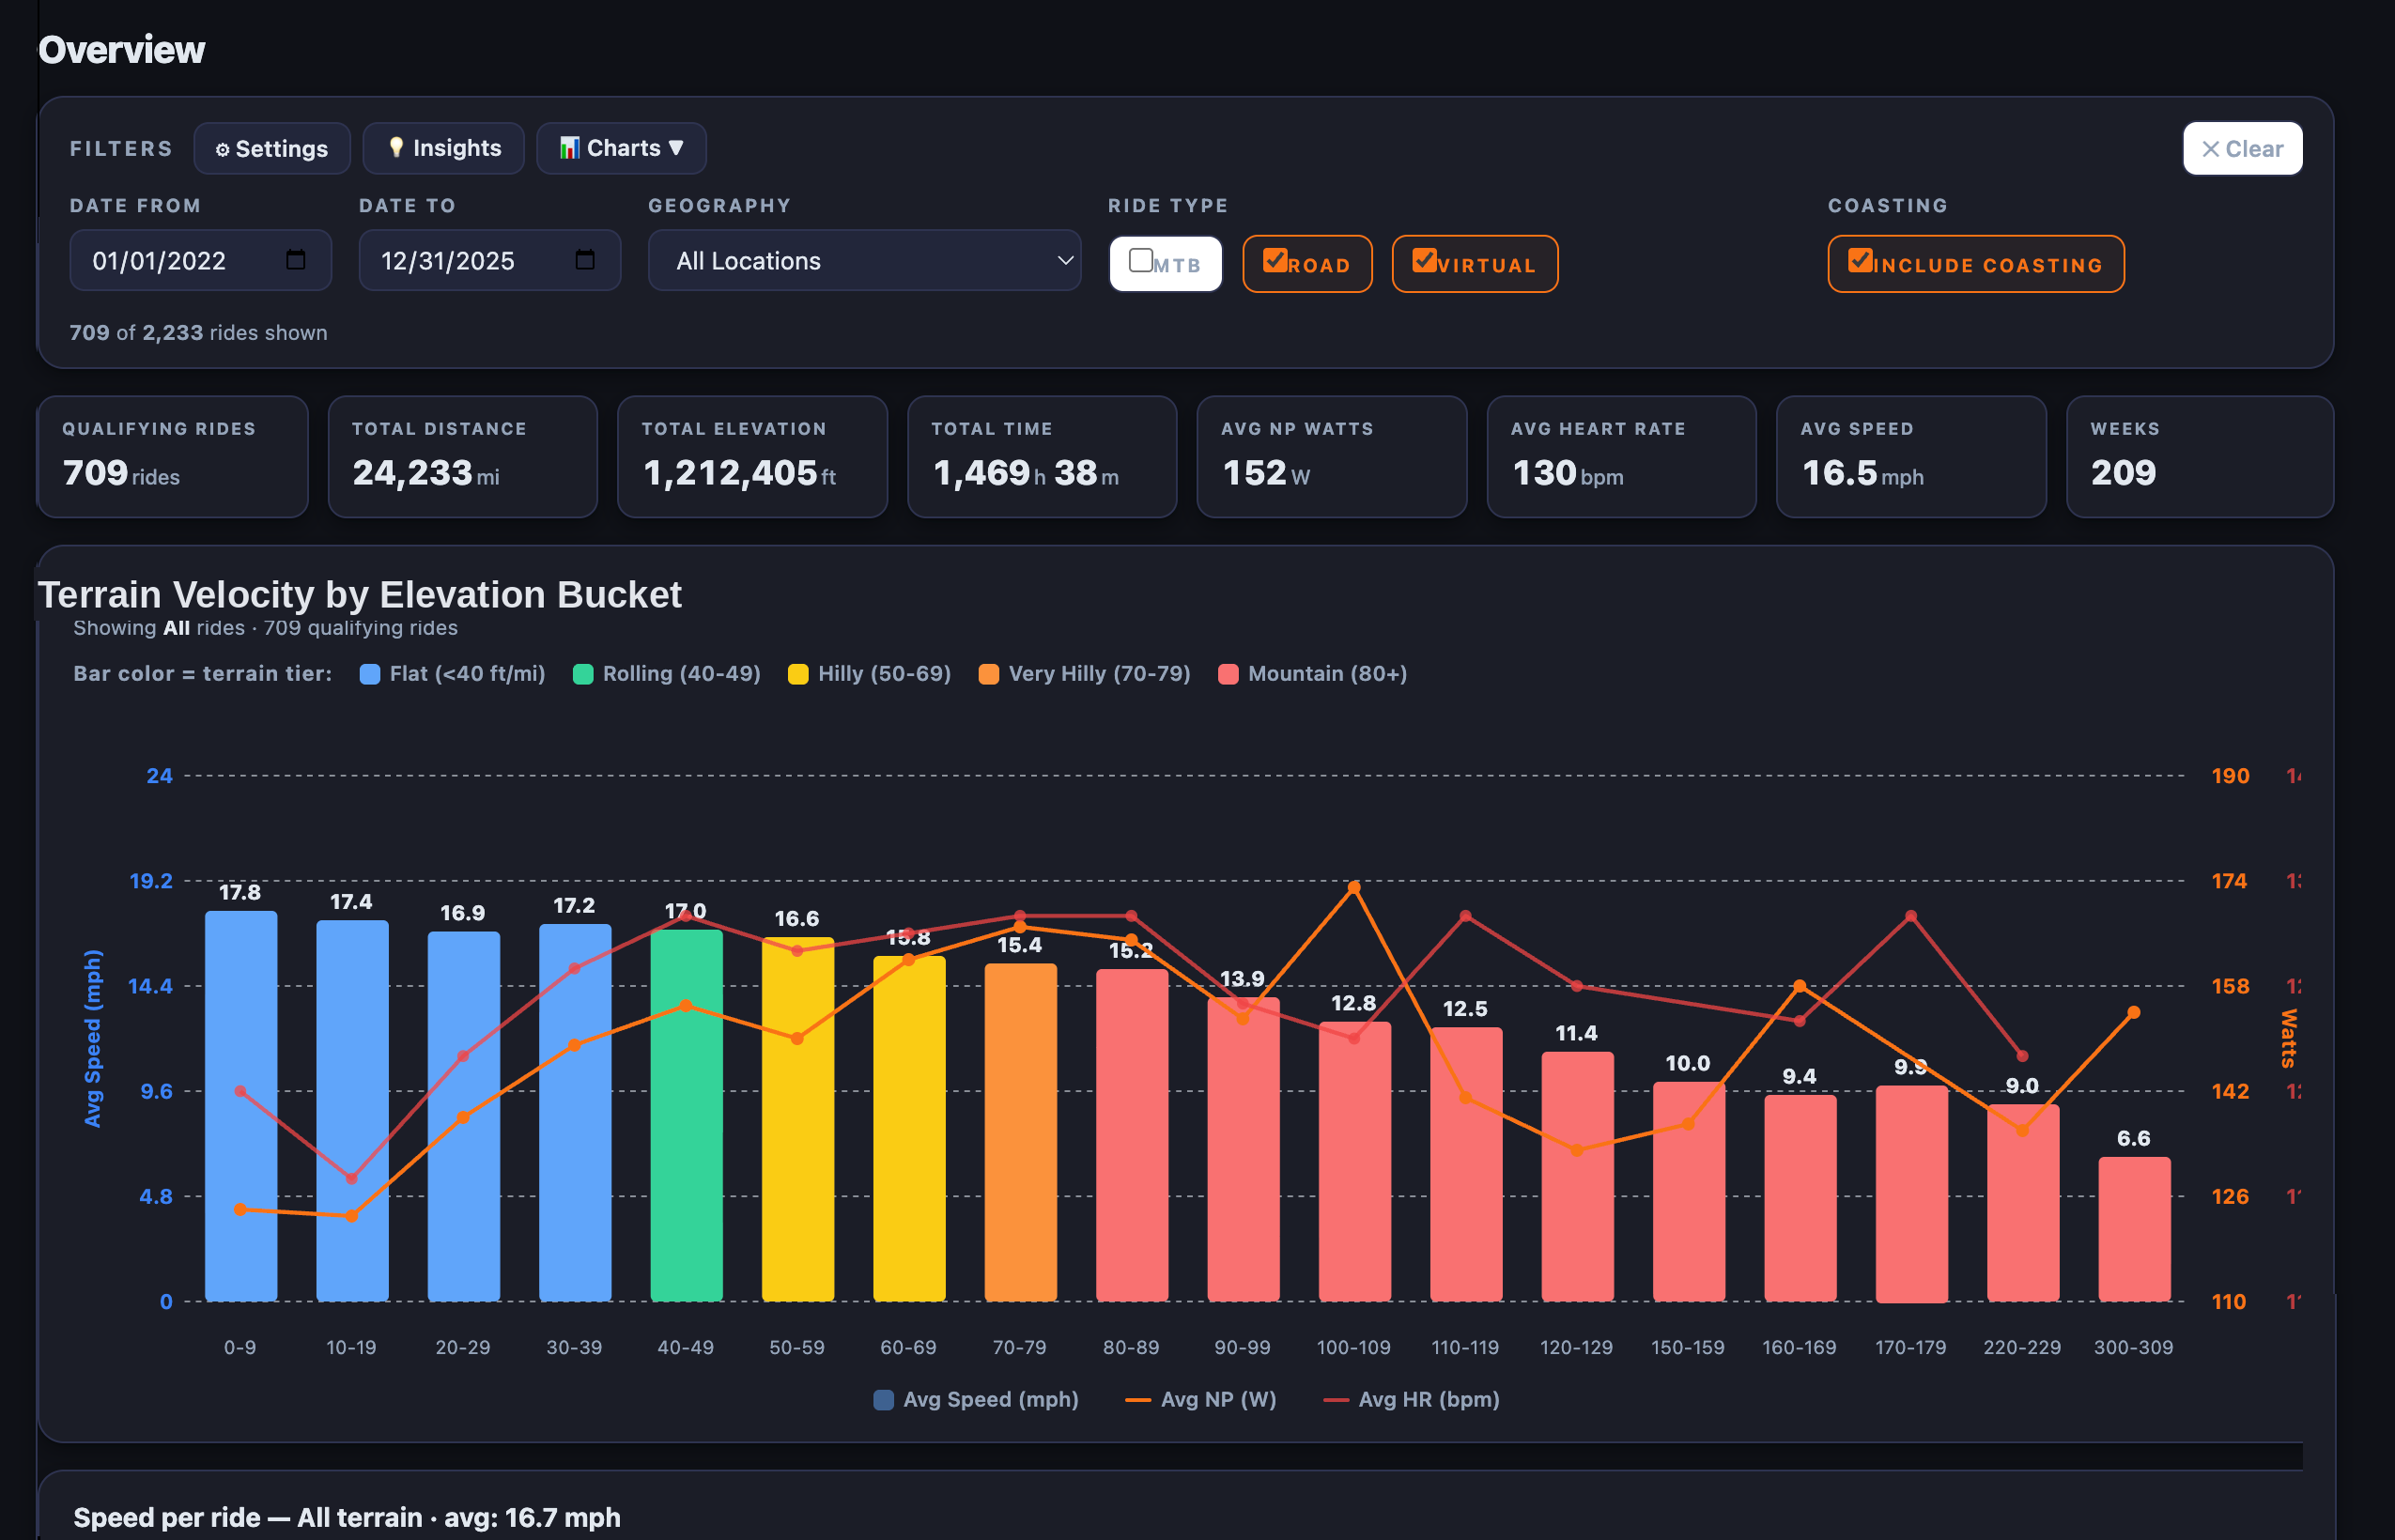
Overview. The deep dive. The Terrain Velocity by Elevation Bucket chart is the headline — a bar chart of your average speed per terrain bucket, with drill-down to the underlying rides for any bar. Alongside it: a speed-per-ride scatter with Speed / NP / HR modes, a Terrain Position quadrant card showing where your strengths cluster, a Weather Impact card quantifying the cost of wind and temperature, and goal rings with pacing.
Activity Feed. The chronological view. Each card surfaces distance, terrain, elevation gain, NP, average speed, and a route-PR badge if the effort was your fastest on a matched route. Celebration pills light up red when you cross a threshold — distance century, terrain century, or a new personal best on a route you've ridden before.
Ride Detail. Where you go after a ride that mattered. The meta-grid surfaces NP, TSS, IF, VAM, FTP source, weather, device, source provider, and your power and HR zone breakdowns. Below that: an elevation profile, the route map, segments with attempt history, and matched rides — the catalogue of every prior ride you've done that shares this route.
What you can't get anywhere else
Two features that go further than what's available in any other cycling app:
Head-to-head replays — segments and full routes. Strava can compare your efforts on a single segment. CycleLytic does the same for full routes — pick any two of your rides on the same physical route, watch them race each other on the map, with synchronized elevation traces beneath. Both segment and route replays compress paused samples so the playback clock reflects moving time, not elapsed time. It's the closest thing to a re-ride you'll find.
Multi-provider. Strava, Hammerhead, Wahoo, Suunto, ROUVY, Zwift. Connect any combination. CycleLytic deduplicates rides across providers, picks the best stream data per ride, and treats everything as one history. Switch head units mid-season without losing your training arc.
What this means for your riding
If you train by feel and don't care about numbers, this isn't for you. But if you want honest answers to questions like “am I actually getting faster?”, “where are my real strengths?”, or “did the wind explain that bad effort or am I detraining?” — that's the gap CycleLytic fills. Terrain-categorized analytics surface signals that raw averages bury in noise.
Free tier covers the At-a-Glance dashboard, the Overview, the Activity Feed, and a single provider connection. Pro unlocks multi-provider, head-to-head replays, route building, training plan integration, and full goal tracking. First three months of Pro are free — no credit card required to start.
You ride enough that the data matters. See it for yourself at cyclelytic.com.